Description

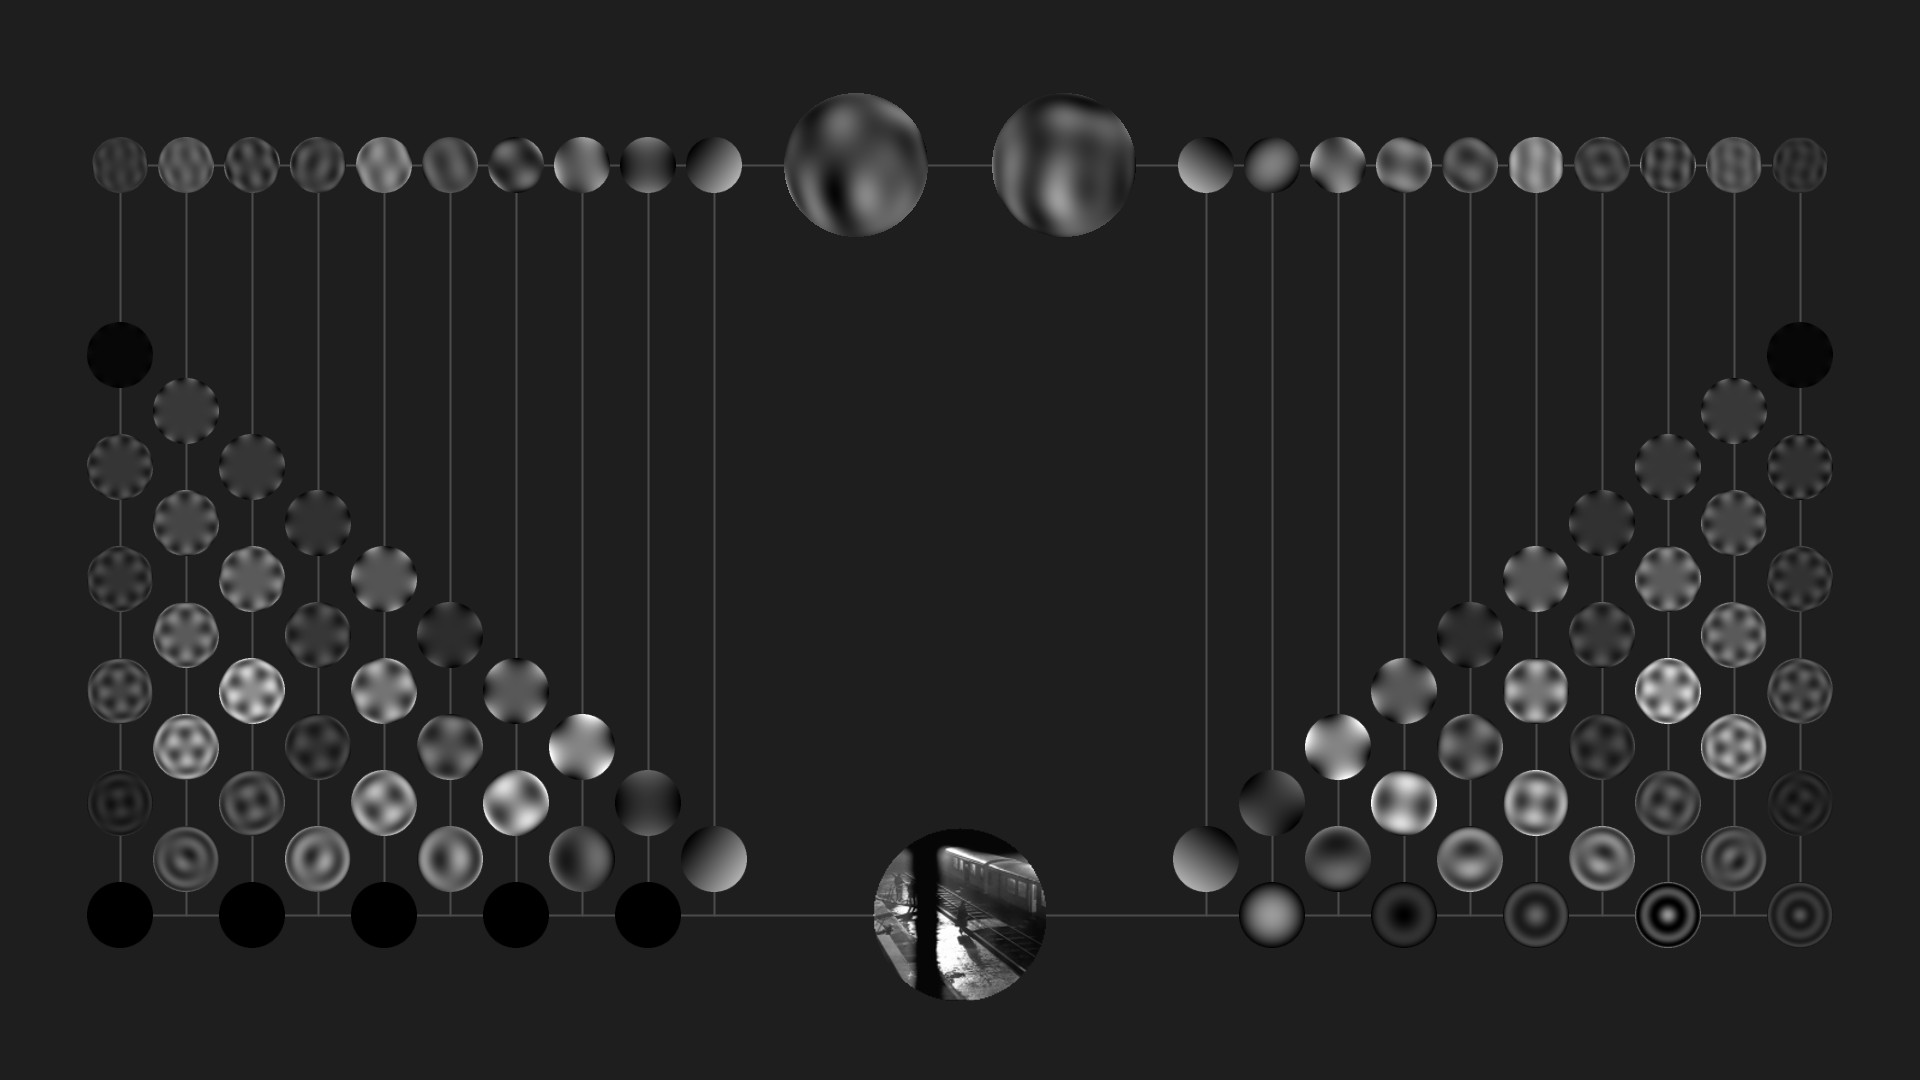
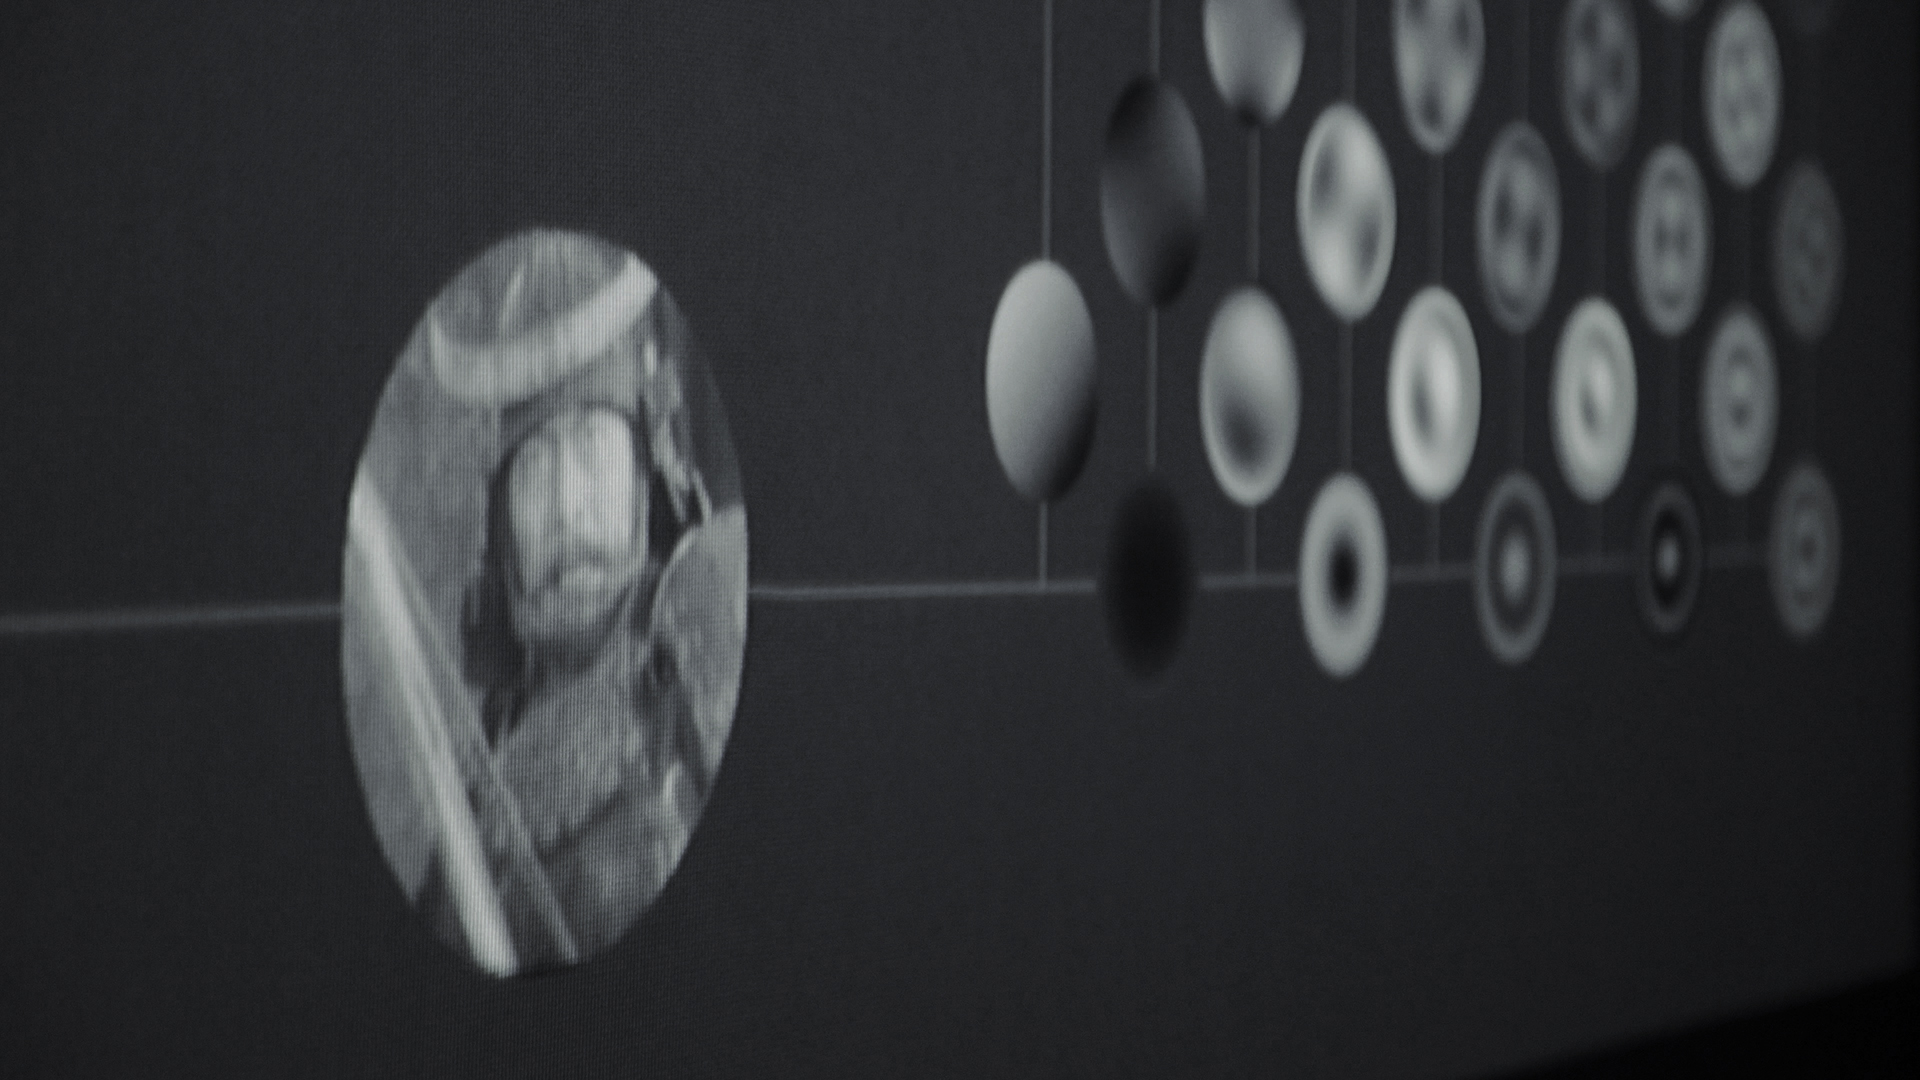
Z is a moving image analysis system that produces abstract representations of video sequences using a system of predefined grayscale disks.


(click to see full size image)


Visually, the disks are characterized by two properties: their radial order (the number of concentric rings) and their frequency or repetition (the number of circular sections). Disks of the same order are shown on the same column and those of the same frequency are shown on the same row.

The visual content of each frame in the movie is represented by rotations and brightness changes in the various disks. Changes in the higher frequencies reflect changes in the smaller details of the source image. Changes in the lower frequencies reflect changes in the overall shape of the source image.


The following example is an analysis from the Hungarian film My Way Home (Miklos Jancso, 1964). It is best viewed in HD fullscreen.


The following example is a section of the opening sequence from The Man from London (2007, Béla Tarr and Agnes Hranitzky). It is best viewed in HD fullscreen.


The Z system describes a video sequence as changing configurations of circular shapes. This representation does not correspond to any pre-existing concepts used in film theory and criticism. For instance, it is not the case that one disk represents the amount of camera movement while another represents the camera position or angle. None of the information contained in any of the disks has a clear interpretation in terms of traditional cinematic categories. Instead, Z raises the possibility of using computer technologies to generate novel methods for the description and analysis of cinematic sequences. Additional clips can be viewed here .

An important inspiration for this project is Soviet filmmaker S. M. Eisenstein's suggestion that cinematic images are akin to musical overtones. (Einsenstein 1988, 182-5) An image is for Eisenstein the total sum of many visual overtones. The interest of Eisenstein's proposal lies in the suggestion that we ought to pay close attention to the subtle and varying micro-events of a moving image stream, but the notion of a visual overtone was not precisely defined and has not been adopted by cinema theorists. Z supplies a mathematical formalization of Eisenstein's idea, enabling a precise decomposition of an image into local harmonics, and encourages the viewer to pay close attention to the dynamic graphical properties of cinematic sequences.

Z can be appreciated at several levels. First of all, it is an abstract work of art in the tradition of visual music (Hans Richter, Viking Eggeling, Oskar Fischinger, Len Lye), where abstract patterns are generated by data from the input video sequence. Secondly, it provides a method of decomposition that sensitizes the viewer to changes in the video sequence. By observing the vicissitudes of the disks, we can learn to pay attention to the purely visual or graphical changes in the input video. Thirdly, it is a work of visual mathematics that aims to construct a bridge between the abstract world of computational procedures and the sensory world of visual representation. The technical background is explained in detail here.

Z employs a mathematical framework originally devised by physicist Frits Zernike to describe the aberrations of microscopes, telescopes and other optical systems that have circular pupils. The circular shape of the disks evokes the images seen through (e.g.) a microscope. Just as the microscope grants perceptual access to what cannot be seen by the naked eye, so the disks in Z draw attention to the often unnoticed micro-events of a moving image.

The following documentation explains the main idea informally.


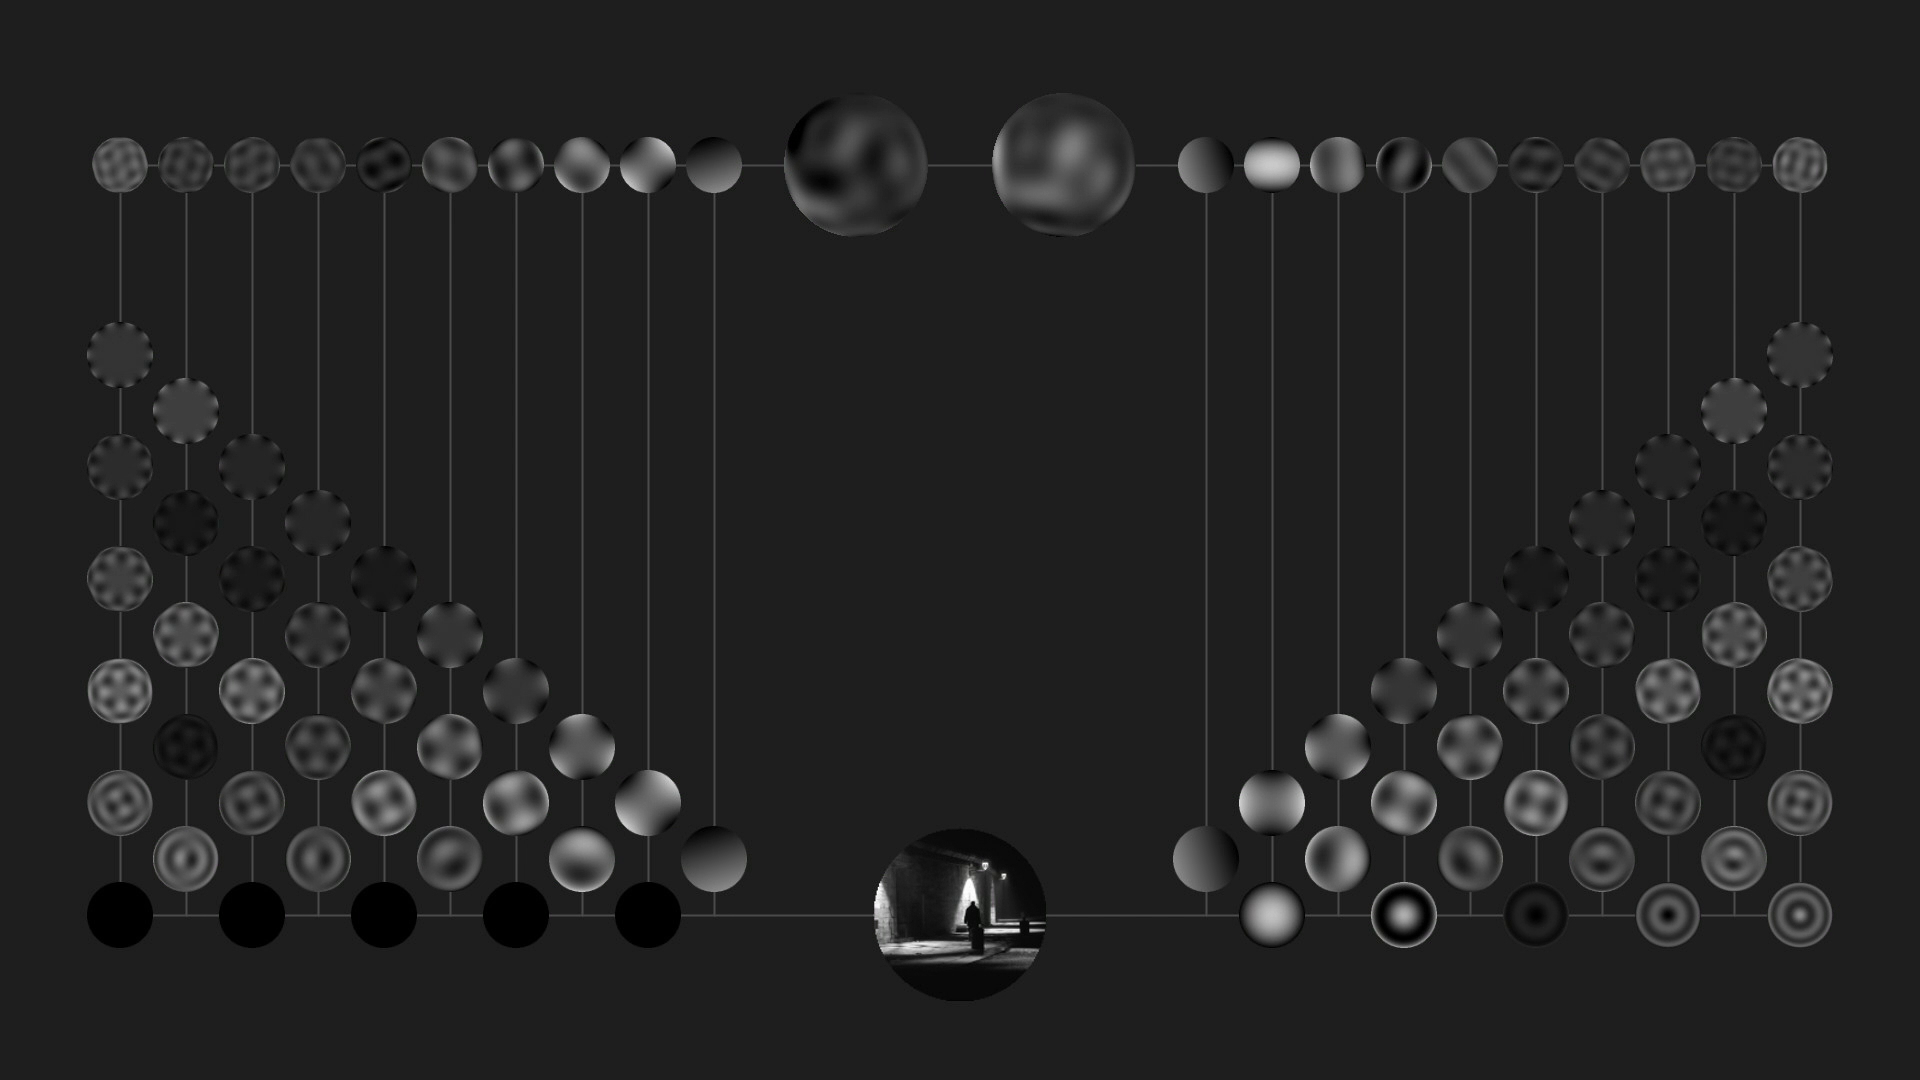
Z explores the application of Zernike's framework to the analysis and synthesis of moving image sequences. The overall visual design of the system constitutes a diagram of the various procedural steps in the computation of the Zernike moments of a moving image, self-reflexively exposing the computational process on which the system depends. The graphical composition expresses the idea of a circuit, starting with the source image displayed in the lower part and ending with its reconstruction in the upper part. This visual approach affirms the aesthetic value of process-based diagrammatic representation in the context of computational art.

_____________

References

Eisenstein, S. M. 1988. "The Fourth Dimension in Cinema" In Richard Taylor, ed., Selected Works, Volume 1, 182-5. London: BFI.


Development of this project was partly funded by City University strategic research grant 7004725.

Mathematical Framework

Every frame in a video is projected onto a finite subset of the Zernike Polynomials. The Zernike Polynomials are complex polynomials defined on the interior of the unit circle and expressed in polar coordinates (ρ, θ). (Teh and Chin 1988, 496-513) Before introducing the polynomials, we define the one-dimensional and real-valued radial function R (ρ):

The two-dimensional, complex-valued Zernike polynomials are defined as:

where n (the "order" of the polynomial) is a non-negative integer and m (the "frequency" or "repetition") is an integer such that n - |m| is even and |m| ≤ n.

The Zernike polynomials are orthogonal, since they satisfy the property:

where

The Zernike moment of order n with repetition m for image f (x,y) is:

where * denotes the complex conjugate. This definition is given for the continuous case, i.e., for an analog image function. Since a digital image consists of sampled values, the double integration must be replaced with a double summation:

To compute the moments of any given source image, its coordinates must first be mapped onto a square of side length 2 and its origin must be translated to the image center. The calculation of the moments will ignore pixels outside a circle of unit radius centered in the origin.

The contribution of the Zernike moment of order n with repetition m to the representation of an image is given by:

The orthogonality of the Zernike polynomials implies that there will be no redundancy in the information contained in moments of different orders and repetitions. The contribution of each moment will be unique and independent of the contributions of other moments. It will capture distinct aspects or "overtones" of the source image.

Z visualizes the contributions of the various moments as grayscale disks, which represent an analysis or decomposition of the input image. The real parts of the Zernike contributions are shown on the right side and the imaginary parts on the left. Since both the real and imaginary parts may contain negative values, the numbers must be transformed to the standard grayscale interval [0,255] for visualization purposes. For every specific order n and repetition m, the maximum and minimum values of the real and imaginary parts of AnmVnm(ρ, θ) are obtained, and each real and imaginary part is linearly mapped from [min, max] to [0, 255]. The resulting grayscale values are then weighted to reflect the relative contribution of that Zernike moment to the reconstruction of the entire image. The weights are given by:

where |Anm| is the magnitude of Anm, m is the maximum magnitude of all Anm, and the exponent a is a parameter in the interval [0,1]. A lower value of a will tend to brighten the disks and a higher value will darken them. The intensity of each disk thus expresses its relative contribution to the overall reconstruction. This weight can also be multiplied by a factor that can be tuned to render the visual result more psychologically convincing. For instance, we might multiply wnm by |A00|/255 . The motivation for this is that the zero-order moment A00 contains the average brightness of the source image, just as the DC component of the Discrete Fourier Transform. Using the zeroth moment as a factor adjusts the brightness of the disks in accordance with changes in the brightness of the source video. A more detailed discussion of the design decisions can be found in the visual composition page.

The total contribution of the Zernike moments of order n is given by:

The source image can in theory be perfectly reconstructed by summing up the contributions of infinitely many moments. Since the computation of an infinite summation is impossible, only an approximate reconstruction is possible up to a finite number of orders and repetitions:

The real and imaginary parts of the total contribution of each order are shown on the top right and left of the visualization. The real and imaginary parts of the approximate reconstruction of the source image are shown on the top center. In visualizing these two parts, the value of the zero-order moment A00 is added to the brightness value for each pixel in the real and imaginary reconstructions. Since this moment contains the average brightness of the input image, adding it to each of the reconstructions serves to translate the values of the pixels to a range that visually matches the overall intensity of the original.

(click to see full size image)

_____________

Reference

Teh, C. H. and Chin, R. T. July 1988. "On image analysis by the method of moments." IEEE Transactions on Pattern Analysis and Machine Intelligence 10(4):496-513.


Visual Representation

The visualization is designed to produce a psychologically convincing representation of the algorithm. The aim is, first of all, to produce the visual impression that the original image is decomposed into the various disks. To this effect, it is important to make it immediately evident that the disks are changing in response to the source image. The intensities of the various disks must be high enough so that changes are perceivable, but their brightness cannot be too different from that of the source image, because in that case the viewer will not perceive the connection between the disks and the source image. Secondly, it is important to highlight that the disks on the top row of the composition are generated by summing up the various disks. In particular, the two reconstructions must visually appear to be closely related to the other disks. Thus the real and imaginary reconstructions must not be too different from the source image and from the various disks used to reconstruct them. Please see the mathematical framework section of this website for further details of the actual computation of the pixel values for the various disks.

The intensities of the disks must be carefully tuned so as to produce an illusion of relatedness among the various parts of the graphical design while respecting the integrity of the data and the autonomy of the algorithm being represented.

The word "illusion" is important here. According to philosopher Suzanne Langer (1950, 219-233), every artistic representation must induce some form of illusion. The main task of the artist is the establishment of a "primary illusion".

This illusory character is related to the need for the creation of a closed or total form. More specifically, the primary illusion of algorithmic visualization is the illusion of relatedness among the various components of the algorithm. It must be immediately clear to the viewer, with minimal verbal coaching, that the various parts of the visual composition are closely connected to one another. For instance, that the various disks change in response to the image and that the reconstructions are related to changes in the various disks. While the exact nature of the process may not be immediately evident, the overall pattern, the graphical or dynamical relation between the various elements, should be perceptually clear. The global image must be perceived as an integral whole, a total form.

(click to see full size image)

The design refers to aspects of the analysis of an image into Zernike moments that are typically not visualized or discussed outside of technical contexts. The source image consists of real numbers (or rather, floating point approximations), but the Zernike decomposition uses complex numbers. The graphical composition of this work alludes to the complex numbers by visualizing their real parts on the right of the image and their imaginary parts on the left. Moreover, the reconstruction of the original frame (top center) is also shown as real and imaginary parts.

Complex numbers are often taken to have no physical interpretation. The aim is to reveal what might be called a "residue" or a "trace" of the process, which is given by the use of the complex numbers, to attempt the (perhaps impossible) task of rendering this residue visible. This visualization aim is essentially illusory, because complex numbers are abstract objects and cannot properly speaking be visualized as such. Like every artistic project, Z establishes its own primary illusion.

_____________

Reference

Langer, Susanne K. Summer 1950. "The Primary Illusions and the Great Orders of Art." The Hudson Review:496-513.


Additional Videos

This page contains some additional video clips, to demonstrate the range of possibilities afforded by the project.


The following video comprises a long sequence from Under Capricorn (Alfred Hitchcock, 1949). The film is remarkable for its use of the long take to generate a careful choreography of both camera movements and human body movements. The scene is rhythmically organized around moments of motion and stasis. The Z system brings out the internal dynamics of the sequence, the way that Hitchcock organizes the illusion of cinematic duration and movement.


The following video contains a sequence from Throne of Blood (Akira Kurosawa, 1957). This sequence generates an overall sensation of agitation leading to a more static moment. Again, the disks capture the internal rhythm of the sequence.

Exhibition Setup

The work can be shown as a single-channel video. The content is an extended (36 minute) clip from The Man From London.


media information

- dimension: 1920 x 1080p (Full-HD)
- format: MOV file, H.264 codec
- no audio
- best viewed with vlc player


This single-channel version can be viewed on a monitor. The preferred size is 64 inches, although a smaller size is also possible. It can also be shown with a full HD projector.

If a projector is used, care must be taken to ensure that the venue is very dark. If the work is shown on a monitor, care must be taken to ensure that direct sunlight does not fall on the screen. The monitor can be placed in an illuminated room, and total darkness is not required.

One possibility is to show this work in a location that suggests the idea of re-learning how to look at media images, or reframing the moving image heritage, such as for instance a classroom, cinema/art museum, or media archive.

The full power of this work is evident when different clips can be compared with one another. Various 2D displays can be distributed, for instance, across various desks or tables in a classroom or media library, so that visitors can freely move across different monitors and compare/contrast various clips. The presentation format can be modified to fit the architecture and function of the exhibition venue. The size of each monitor can be smaller than that of the single-channel version.


It is far better to show it as a two-channel installation that shows two videos, one from The Man From London and another from Throne of Blood.

This two-channel version allows the viewer to compare and contrast the representations of these two very different movies. It is also possible to include more channels, and so more clips, if the resources allow.

The video channels need not be synchronized, so the installation is relatively simple.


An exhibtion setup in Hidden Variables, from Writing Machine Collective edition 6. Hong Kong. Sep-Oct 2018.

CREDITS


ARTIST & TECHNICAL DIRECTOR

HECTOR RODRIGUEZ


PROGRAMMING

HECTOR RODRIGUEZ
PHILIP KRETSCHMANN
HUGO YEUNG


MATHEMATICAL ADVISOR

FELIPE CUCKER


WEB DESIGN

PHILIP KRETSCHMANN
HUGO YEUNG


TEXT

HECTOR RODRIGUEZ


THANKS

FRITS ZERNIKE


PRODUCED AT

School of Creative Media, CITY UNIVERSITY OF HONG KONG